Latin Hypercube Sampling is an improvement over Monte Carlo Sampling. In one dimension, it generates numbers that are evenly spaced in probability. For multiple dimensions, the numbers are randomly paired, so there is more randomness in the output. However it avoids clusters and generally outperforms Monte Carlo.
If you looked at the previous section on Monte Carlo Sampling, you will need to make just a minor change to your control script to use Latin Hypercube Sampling.
Change the line that says:
uq = MonteCarlo([x,y], num=num)
to:
uq = LHS([x,y], num=num)
Or use ‘rosen_lhs.py’ in puq/examples/rosen.
~/puq/examples/rosen> puq start -f rosen_lhs.hdf5 rosen_lhs
Saving run to rosen_lhs.hdf5

Processing <HDF5 dataset "z": shape (20,), type "<f8">
Mean   = 516.828
StdDev = 634.386086052

~/puq/examples/rosen> puq plot -r rosen_lhs.hdf5
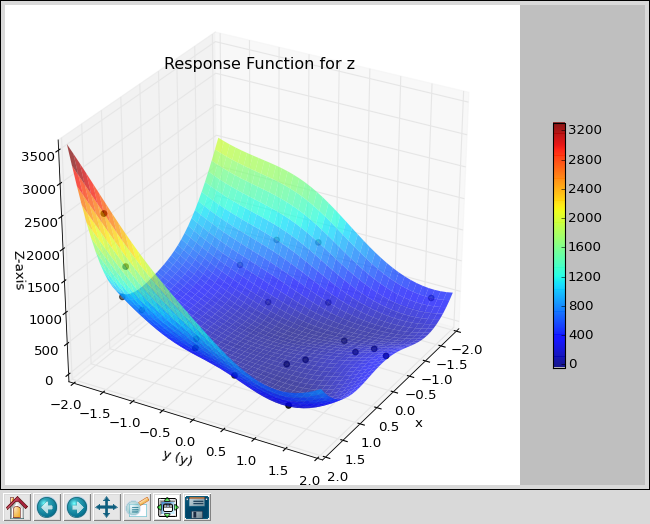
Scatter plot for Rosenbrock function using LHS with 20 samples.
~/puq/examples/rosen> puq extend rosen_lhs.hdf5
    Extending rosen_lhs.hdf5 using LHS
    Extending Descriptive Sampling run to 60 samples.

Processing <HDF5 dataset "z": shape (60,), type "<f8">
Mean   = 495.208576132
StdDev = 605.837656938
~/puq/examples/rosen> puq plot -r rosen_lhs.hdf5
plotting z
~/puq/examples/rosen> puq plot rosen_lhs.hdf5
plotting PDF for z
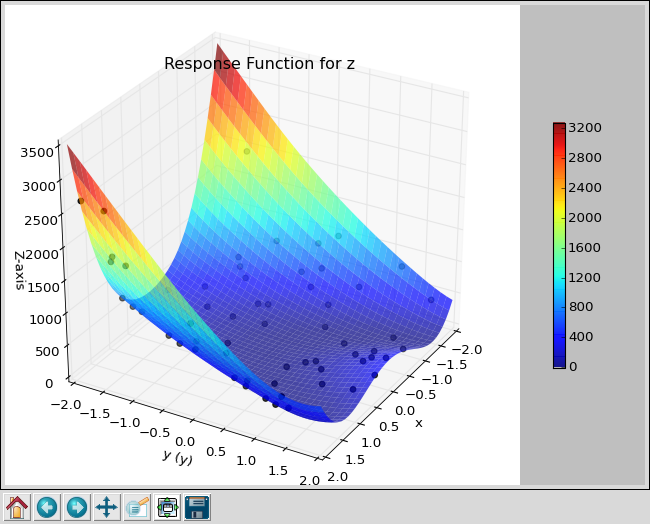
Scatter plot for Rosenbrock function using LHS with 60 samples.
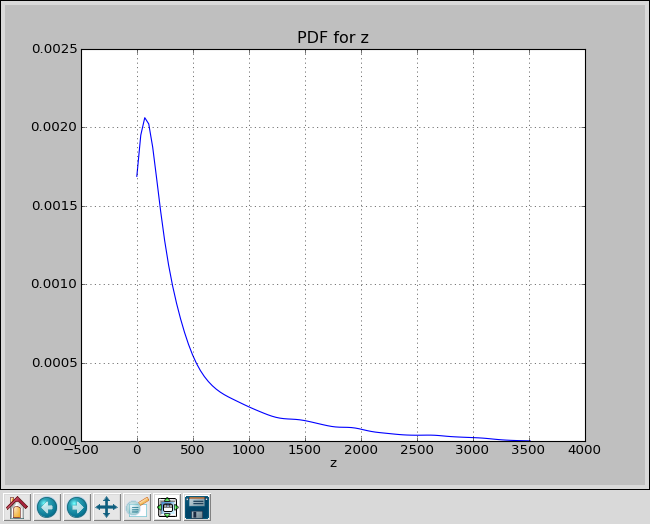
PDF for Rosenbrock function using LHS with 60 samples.